Abstract: This article describes Acrel-2000 power monitoring system software based on Acrel , which provides a basic platform for real-time data acquisition, switch status detection and remote control of the system through the use of computers, communication equipment, and metering protection devices. The system can provide enterprises with "monitoring and integration" of the overall solution, the system realizes the microcomputer in the power distribution room in the unmanned management function, eliminating the on-site operation of on-duty personnel disorder, improve the power quality and management level , Concise and practical, less investment and other advantages.
Keywords: power monitoring software; network power meter; oumu specialty paper
0 Preface
    In recent years, with the continuous improvement of the degree of modernization of power grids, substations will be digitized and intelligently developed. Intelligent electronic equipment will be increasingly used in the field of protection, control and measurement in substations. The application of the power monitoring system can significantly improve the reliability and real validity of the data, thereby improving the standardization of management. The network power meter installed on the monitoring side communicates with the power monitoring system of the power distribution and distribution station and can provide sufficient power system status. Data, thus improving the operation and maintenance level of the entire substation.
    The application of Acrel-2000 power monitoring software in Zibo Oumu Special Paper Co., Ltd. has successfully realized the centralized collection of power parameters at the customer side of the power distribution side , providing reliable power monitoring and energy saving optimization for Zibo Oumu Special Paper Co., Ltd. Data basis and platform.
1 Project introduction
Zibo Oumu Special Paper Co., Ltd. is a wholly-owned subsidiary of Shandong Qifeng Special Paper Co., Ltd. In 2003 , the company was named by the Ministry of Science and Technology as the backbone enterprise of the national new material industrialization base. In 2004 , it entered the list of the top 100 taxpayers in the private sector in the country. The company owns the Shandong Provincial Enterprise Technology Development Center, the Shandong High-end Decorative Base Paper Engineering Technology Center and the Academician's Workstation. , Professor Chen Kefu, the only paper-making academician in China, served as chief expert.  The enterprise is a state-level key high-tech enterprise. Among the top ten papermaking enterprises in Shandong Province and the star enterprises in Zibo City, the “Shuangfeng Brand†series of high-end decorative base paper products have won the titles of “Shandong Famous Brand†and “Shandong Famous Brandâ€. The company passed the ISO9001 international quality, ISO14001 international environment, OHSAS18001 safety three standard management system certification, 2007 and 2008 for two consecutive years by the National Bureau of Statistics rated the high-end decorative paper industry, the national sales, sales of the first, was China's venture The investment community was named one of the top 50 companies with the most investment value in 2009 in China , and was rated as the most investment potential enterprise in 2009 by CCTV Securities Information Channel .
Special Paper Co., European wood Zibo four power monitoring system for a low-voltage distribution chamber mounted within the switch cabinet Zibo Special Paper Co., European wood Acrel of four smart electricity meters, a field of about 120 meters, to the control room Located in the power distribution room , the instrument in the power distribution room is directly pulled to the serial port server through the RVVSP shielded twisted pair, and then connected to the background monitoring host to perform data transmission.
2 user needs
   Shanghai Anke Rui Electric Co., Ltd. System Integration Division of the Euro-wood special paper four power monitoring system to be solved detailed analysis, figure out the project sponsors and other project stakeholders ¸ requirements to be developed information systems to solve After the customer and the user's business problems and the ins and outs of the problem, the two sides informed the power monitoring system should realize the real-time refresh of each feeder circuit voltage, current, power, power factor and frequency monitoring information of each distribution room. Intuitive and dynamic display of the form; Completion of the real-time and historical trend curve of the voltage, current or power of each distribution circuit to facilitate the analysis of the circuit distribution operating conditions; Complete the energy collection function of each circuit, and automatically generate a customer Manage electricity demand report, all reports or charts support query printing function; alarms on the communication status or abnormal power consumption of each monitoring point, so that management personnel can grasp and analyze the distribution operation situation in real time
3 design plan
According to the requirements of high reliability and efficiency of power distribution management, as well as practicality, safety, real-time performance, stability, scalability, and easy to maintain the principles of the Shanghai Anke Rui Electric Co., Ltd. Special Paper on European wood four reconstruction of intelligent power distribution system provides the following design
3.1 Reference Standard
The design of the system meets the following manufacturing and test standards:
ISO/IEC11801 International Integrated Cabling Standard
JGJ/T 16-92 Civil Building Electrical Design Code
GB/J63-90 "Design Specification for Electrical Measuring Instrument Devices of Electrical Installations"
GB/T13730 "Regional Power Grid Data Acquisition and Monitoring System General Technical Conditions"
GBJ63-93 "Design Specification for Electrical Apparatus Electrical Measuring Instrument Device"
GB2887 "Technical Requirements for Computing Station Sites"
GB/50198-94 "Monitoring System Engineering Technical Specifications"
GB50254/59-96 "Electrical Installation Installation Construction and Acceptance Specifications"
IEC-61131-3 Graphics Programmable Standards
GB50052-2009 Â Â Â Â Â Â Â Â Â Â Â Supply and Distribution System Design Specification
DL/T/814-2002 Â Â Â Â Â Â Â Â Â Â Distribution Automation System Functional Specification
IEC 61587 Â Â Â Â Â Â Â Â Â Â Â Â Â Â Electronic equipment mechanical structure series
3.2 Network Structure Diagram Topology
   In order to meet the requirements of the unified monitoring of the distribution room, the installation of the network power meter in the distribution room is connected to the serial server through a shielded twisted pair cable. The serial server is connected to the back-end host through the five types of lines to achieve the collection of on-site data. , storage, processing, real-time display and historical query, as shown in Figure 1:

figure 1
4 main functions of power monitoring system
4 .1 Data Acquisition and Processing
   Data acquisition is the basis of power distribution monitoring. Data collection is mainly accomplished by the underlying multi-function network instrumentation to achieve local real-time display of remote data. The signals that need to be collected include: three-phase voltage U, three-phase current I, frequency Hz, power P, power factor COSφ, power Epi, and remote device operating status.
   The data processing mainly displays the electrical parameters collected according to requirements in real time and accurately to the user, so as to meet the requirements of automation and intelligence of the power distribution monitoring, and store the collected data in the database for user query.
4 .2 Human-computer interaction
   The system provides simple, easy to use, and good user interface. Using the Chinese interface, the CAD graphic shows the electrical main wiring diagram of the low voltage distribution system, shows the status of the distribution system equipment and the corresponding real-time operating parameters, the screen timing switching tour; dynamic refresh of the screen in real time; analog display; switch display; continuous Record display and so on.
4 .3 Diachronic Events
   The duration event viewing interface provides users with easy and friendly human-computer interaction by viewing the fault records, signal records, operation records, and over-limit recordings that have occurred. You can view the platform through historical events. You can easily locate the fault according to your requirements and query conditions. The historical events that you want to view provide you with good software support for the operation of the entire system.
4 .4 Database Creation and Query
   It mainly completes remote measurement and remote signal acquisition, and establishes a database to generate reports regularly for users to query and print.
4 .5 User Rights Management
   For different levels of users, different permission groups are set to prevent the losses caused by human misoperation to production and life, and to realize the safe and reliable operation of the distribution system. You can use user management to perform user login, user logout, password change, and add/delete operations to facilitate the user's modification of accounts and permissions.
4.6 the operating load curve
   The load trend curve function is mainly responsible for regularly collecting incoming lines and important loop current and power load parameters, and automatically generating running load trend curves to facilitate users to understand the operating load status of the equipment in a timely manner. Click the corresponding button or menu item of the screen to complete the switching of the corresponding function; you can view the real-time trend curve or historical trend line; you can perform the operations such as pan, zoom, and range conversion for the selected curve to help the user to enter the trend analysis and fault recall. Analyzing the entire system's operating status provides intuitive and convenient software support.
4 .7 Remote Report Query
   The main function of the report management program is to design the report style according to the needs of the user, and the data processed in the system is filtered, combined and statistically generated to generate the report data required by the user. This program can also be based on the needs of users of the report file to save, print or summon save, print mode. At the same time, this program also provides users with management functions for generated report files. The report has the functions of freely setting the query time to realize daily, monthly, and annual energy statistics, data export, and report printing.
5 System Case Analysis
   The host computer software is Acrel- 2 000 power monitoring system configuration software. The software has a friendly human-machine interface, which can collect real-time and time- sequenced parameters of the field devices and switch status, and upload the collected data to the monitoring host. Real-time display and storage. The system also provides analysis of real-time curves and historical trend curves, and meets the functions of reports, event records, and fault alarms required by users' designs. The entire system can realize the collection and statistics of all circuit power consumptions, and realize remote automatic meter reading, power monitoring and power management functions.
5.1 Data Acquisition and System Diagram Display
   The field instrument measures and collects the loop data information. The PC software then collects and stores the data of the field instrument at regular or periodic intervals. The collected time period can be freely set and the minimum system supports the acquisition period. You can view any meter's instantaneous table value, accumulated amount, and other information at any time, and record the voltage, current, power factor, and active power of the power meter within the time interval. These parameter information can be automatically saved to the database for easy querying.
   The system has a friendly man-machine interface, which is convenient for ordinary on-site personnel to view and record relevant information. The system one-time diagram (as shown in Figure 2) not only shows the on-off status of the line, but also displays important power such as voltage, power, and active power in real time. parameter. All data information is regularly saved to the database.
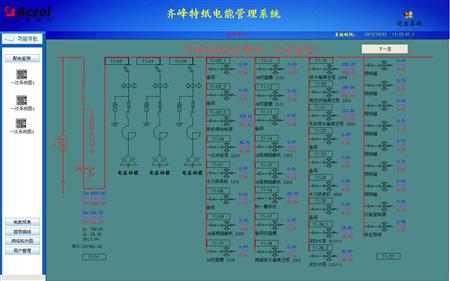
figure 2
5.2 remote meter reading
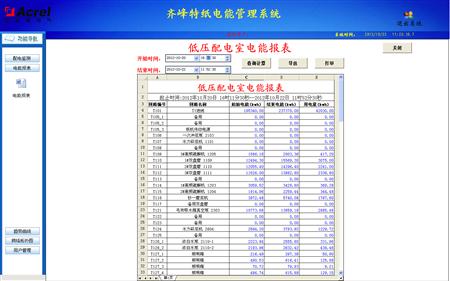
 The system can display all the collected data in real time and store it in the database. Therefore, you can manually query all the real-time and historical electrical parameters of each loop and present it to the user in the form of a table for easy printing and saving. As shown in Figure 3.
Figure 3
5.3 trend curve:

The important loop current, power real-time trend display and historical trend query function. After selecting the loop, the real-time trend curve of the loop will be continuously refreshed. Select “Start time†to view the history trend curve of the loop, and select “Time length†to view the history curve of the date, month, and year, which can more intuitively reflect the loop operation. Situation, as shown in Figure 4
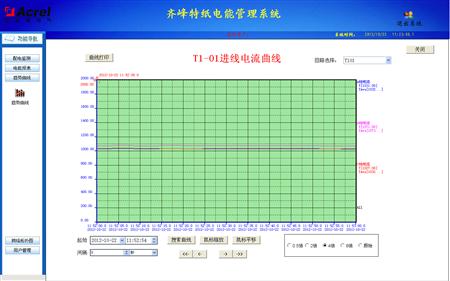
Figure 4
5 . 4 Â Alarm prompt and query interface : real-time and historical alarm interface of power monitoring system , real-time alarm will pop up alarm window prompt, historical alarm is obtained through query, as shown in Figure 5, 6 below :
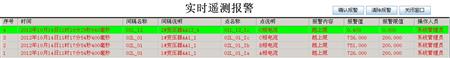
Figure 5
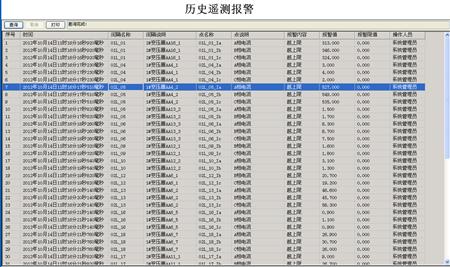
Figure 6
5 Effect Analysis after Project Implementation
Realize centralized collection of data and reduce management costs: It can realize centralized collection and recording of various electrical parameter data, concentrate on data analysis, reduce the precipitation of substation data, and focus on information reflection.
    Compatibility and scalability analysis: The Acrel-2000 intelligent power monitoring system fully considers the interconnection and interoperability with the BA system, avoids becoming an island of information, and can be connected with the building automation system that is being implemented or will be implemented with only minor adjustments. , can fully protect the company's investment.
Maintain the originality of the data and prevent it from being modified: The original method of transmission by the on-site electrician to the management after reading the meter increases the chance of the leader reading the dirty data due to changes in the data copying process. Acrel-2000 Intelligent Power Monitoring The system maintains the originality of the data and facilitates the leadership to understand the real data.
6 Conclusion
This paper takes the three-tier network topology of Acrel-2000 intelligent power monitoring system as the core, analyzes the selection of network topology, and the functions and performance indicators of Acrel-2000 power monitoring system. In the power monitoring system, configuring the network power meter has obvious advantages such as simple implementation and low investment, which can conveniently and real-timely monitor the running status of the power distribution system, and perform unified management of on-site power equipment, eliminating the need for staff to go to the site. The tedious work of recording, the system manages and analyzes the historical operating data and status of various electrical equipment, facilitates the maintenance personnel to clarify equipment conditions, formulates detailed equipment maintenance plans, reduces staff, and improves efficiency.
For more information, please contact!
Shanghai Ankerui Electric Co., Ltd.
Contact: Xu Shuang Telephone 18321975993
E-mail: QQ
Painted Aluminum Die Casting,Die Cast Enclosures Aluminum Box,Aluminum Waterproof Electrical Junction Box
Light Housing Co., Ltd. , http://www.nsadiecasting.com